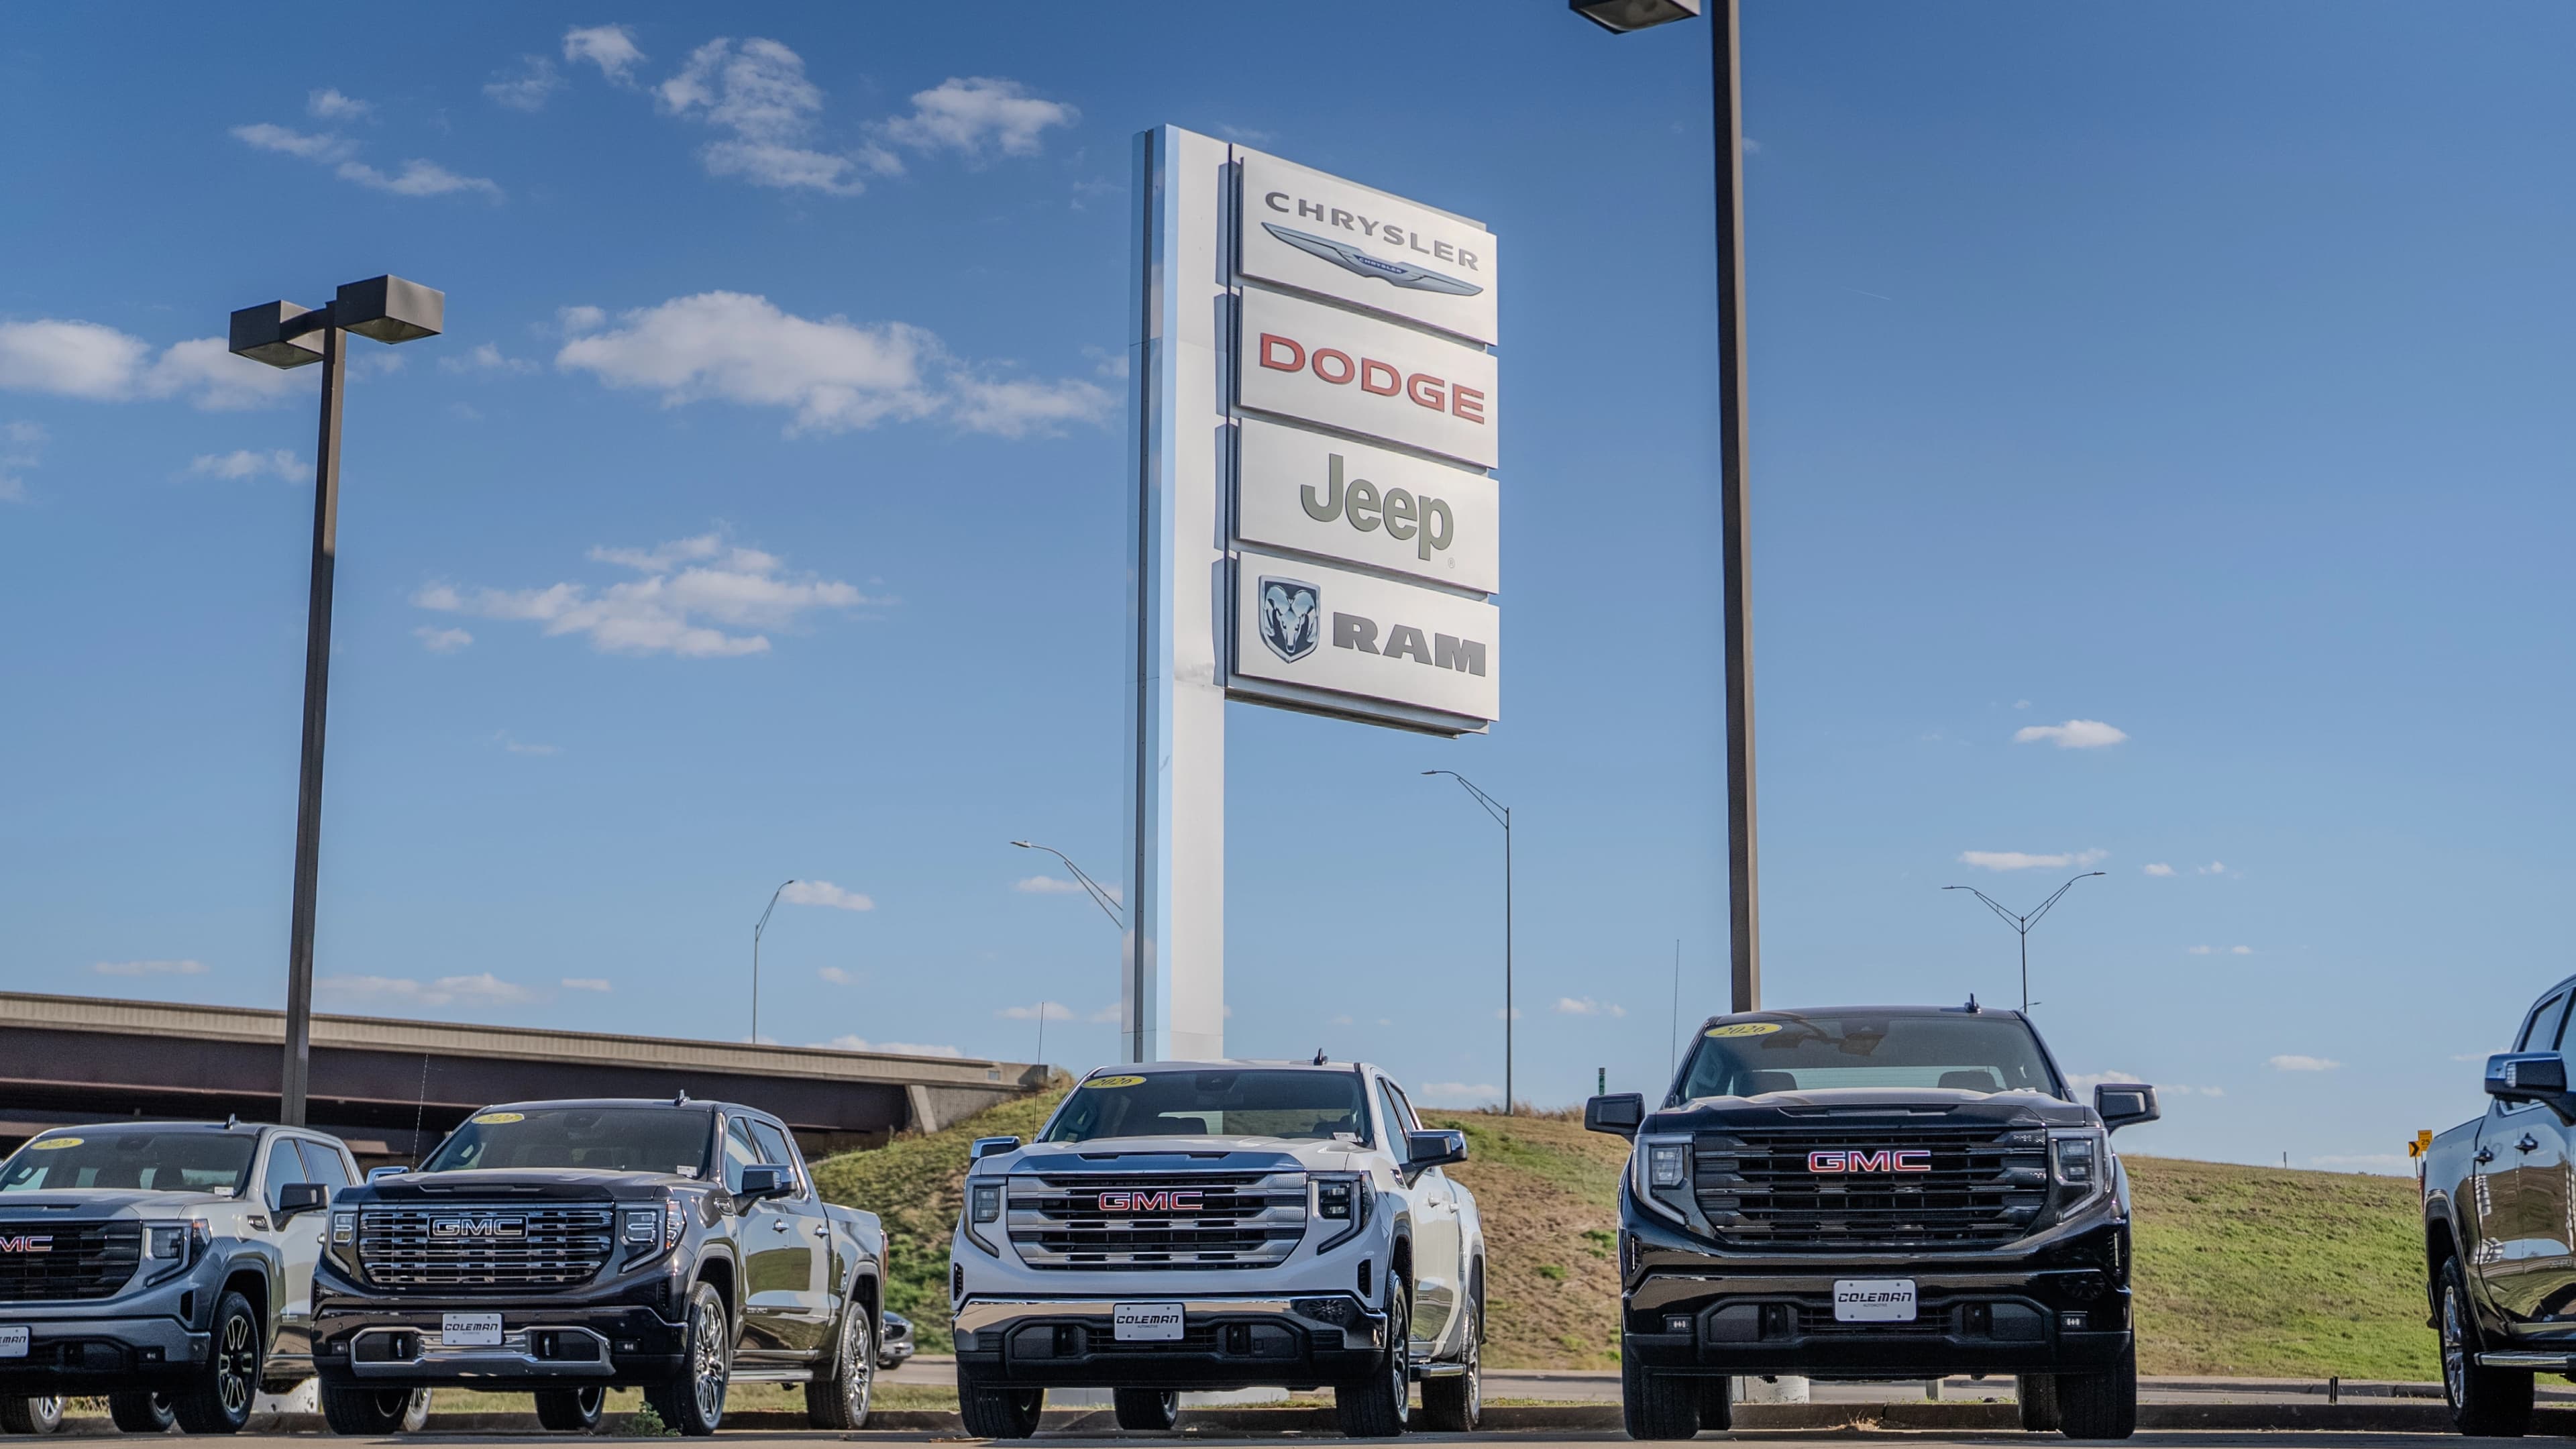
A Coleman Automotive dealership. Fixed operations generate nearly half of total dealership gross profit — on roughly 12% of total revenue. Photo: Sweet Dreams US LLC
Fixed Operations: The Recurring Revenue Engine Most Investors Don’t Know About
The showroom sells the car. The service bay pays for the building. Understanding the difference changes the entire investment thesis.
Ask most people what a car dealership does and they will tell you it sells cars. Ask an investor what makes a dealership valuable and they will point to sales volume, market share, and new vehicle margins. Both answers are incomplete — and if you are evaluating a dealership as an investment, both answers will lead you to the wrong conclusion.
The showroom floor is the most visible part of the operation. It is also the most volatile, the most margin-compressed, and the most dependent on economic conditions the dealership cannot control. The department that actually pays for the building — that covers the rent, the utilities, the insurance, the administrative overhead, and the baseline payroll before a single car is sold — is behind the showroom, through the double doors, in the service bays most customers never think about.
Fixed operations — the service, parts, and collision departments — represent roughly 12% of a dealership’s total revenue. They also generate approximately 49% to 50% of the dealership’s total gross profit. That inversion is the single most important number in the automotive retail investment thesis, and most investors outside the industry have never seen it.
We introduced the concept of the four-legged revenue model in the first post in this series. This post goes deeper into the leg that holds the most weight.
Two Businesses Under One Roof
A franchised dealership is not one business. It is two — operating under the same roof, sharing the same overhead, but running on fundamentally different economics.
The first business is variable operations: new vehicle sales, used vehicle sales, and finance and insurance. This is the high-visibility side. It generates roughly 88% to 90% of total revenue. It is also where margins are thinnest and volatility is highest. New vehicle gross profit margins typically range between 2.5% and 5% in competitive markets. Used vehicles run slightly better at 10% to 12%. But both departments are capital-intensive — financed through floorplan loans that charge daily interest on every unsold unit — and ruthlessly sensitive to consumer confidence, lending rates, manufacturer production schedules, and inventory supply.
The second business is fixed operations: service labor, parts sales, and collision repair. This side generates only 10% to 12% of total revenue. But the gross profit margins are inverted from the sales floor. Service labor margins routinely target 70% to 75%. Parts margins sit between 30% and 50%. The result is a department that produces nearly half of total gross profit on a fraction of total revenue — and does it with a stability profile that variable operations cannot touch.
The reason is structural. Variable operations depend on consumers making a large, discretionary purchase — a decision that is immediately suppressed when interest rates rise, consumer confidence falls, or vehicle prices become unaffordable. Fixed operations depend on consumers maintaining vehicles they already own — a decision that is non-discretionary. A transmission failure, worn brakes, or a check-engine light do not wait for favorable economic conditions. They demand immediate service regardless of what the Fed did last month.
This is why the new vehicle sale is best understood not as the profit event, but as the customer acquisition event. The dealership absorbs thin margins on the front end to bring a consumer into the ecosystem. The real return on that acquisition cost is extracted over the next five to ten years through the service department.
By the Numbers
Revenue vs. Profit — The Fixed Ops Inversion
Variable Ops: 88–90% of revenue → ~50% of gross profit
Fixed Ops: 10–12% of revenue → ~50% of gross profit
Service labor gross margin target: 70–75%
New vehicle gross margin: 2.5–5%
The Absorption Rate: The Number That Determines Everything
If there is one metric that separates a resilient dealership from a vulnerable one, it is the service absorption rate. Every serious acquirer — every CFO, every private equity analyst, every operator evaluating a potential acquisition — looks at this number before anything else on the financial statement.
The calculation is straightforward. Take the gross profit generated by fixed operations — service, parts, and collision — and divide it by the total fixed overhead expenses of the entire dealership: rent, utilities, insurance, property taxes, administrative salaries, baseline technology costs. The result tells you what percentage of the building’s existence is paid for by the service bay before the sales floor contributes a dollar.
The national average sits at approximately 64%. That means the typical dealership’s service department covers roughly two-thirds of the overhead, and the remaining third must be funded by vehicle sales. If the sales floor has a bad month — or a bad quarter, or a bad year — that gap becomes a cash drain.
Now consider a dealership operating at 100% absorption. At that threshold, fixed operations cover every dollar of fixed overhead. The entire gross profit from every vehicle sold, every F&I product originated, and every trade-in retail flows directly to the bottom line as pure net profit. The sales floor is no longer subsidizing the building. It is operating on top of a fully funded foundation. The dealership can price vehicles more aggressively to gain market share, absorb a slow month without panic, and weather an economic downturn that would devastate a store running at 50% absorption.
The financial impact of moving this single metric is enormous. For a dealership with $500,000 in monthly fixed overhead, improving absorption from 64% to 85% adds $105,000 per month in fixed ops profit — $1.26 million annually in highly stable, recurring EBITDA that drops straight to enterprise valuation.
Elite operator groups push their stores to 85%, 100%, and beyond. They do it through disciplined execution: maximizing technician billable hours, optimizing parts inventory turnover, negotiating retail-rate warranty reimbursements from the manufacturer, and building customer retention systems that keep the service bays full. None of it is theoretical. All of it is measurable, repeatable, and directly tied to the quality of the person running the department — which is exactly why we wrote about the talent-first hiring philosophy in the previous post.
From the Floor
“The first thing I look at when we evaluate a store is the absorption rate. If it’s sitting at 50%, I don’t see a problem — I see a massive opportunity. That number tells me exactly how much profit is being left on the table and exactly where to find it.”
— Kyle Coleman, CEO
→ See how the 90-day turnaround addresses fixed opsWhy the Service Bay Survives Everything
The recession resistance of fixed operations is not a theory. It has been stress-tested repeatedly — and the results are unambiguous.
During the 2008 financial crisis, new vehicle sales in the United States collapsed by nearly 40%. Dealerships that had built their entire financial model around the sales floor faced immediate insolvency. Dealerships with strong fixed operations weathered the contraction by pivoting to maintenance, heavy mechanical repair, and used vehicle reconditioning. The service department did not just hold steady. It expanded. Consumers who deferred new purchases were forced to maintain aging vehicles, driving a surge in high-margin service work.
The pattern repeated during the pandemic. When microchip shortages cratered new vehicle production in 2020–2022, dealerships briefly enjoyed inflated per-unit margins from extreme inventory scarcity. When supply chains normalized and inventory swelled back in 2023 and 2024, those margins evaporated. New vehicle gross profit per unit fell 33% — a $2,247 decline per vehicle. Through that painful normalization, fixed operations gross profit across the major publicly traded dealership groups rose 5% to 5.4%. By the third quarter of 2025, fixed ops profit growth accelerated further — up 8.3% year-over-year, driven primarily by customer-pay work that is more profitable and less cyclical than warranty volume.
In high interest rate environments, the shield is equally effective. When rates rise, consumers are priced out of the new vehicle market and floorplan interest costs spike — a dual assault on the sales floor. But the service drive is untouched. A customer cannot defer a transmission failure because the prime rate went up. The service department generates daily cash flow that offsets the margin erosion and inventory cost pressure hammering the variable side.
For the investor, this dynamic transforms the risk profile of the asset. A dealership with optimized fixed operations does not stop generating returns when the economy contracts. It shifts the composition of those returns from volatile sales margins to stable service revenue — and keeps the building funded regardless of what happens on the showroom floor.
The Service-to-Sales Pipeline: Where Retention Becomes Revenue
Fixed operations does not just protect the downside. It actively builds the upside — through a mechanism that most outside investors have never considered.
Every day, dozens of vehicles drive into the service bay. Each one represents a customer who already has a relationship with the dealership, a vehicle with a documented maintenance history, and a data profile that reveals exactly where they stand financially on their current loan or lease. A sophisticated dealership does not treat the service drive as an isolated department. It treats it as a real-time sourcing channel for the sales floor.
Advanced equity mining software integrates the CRM with the DMS to identify service customers who are in a positive equity position, approaching warranty expiration, or nearing lease mileage limits. When a flagged customer arrives for a routine oil change or a tire rotation, a trained advisor can present a data-backed trade-in proposal: here is what your vehicle is worth, here is what the upgrade looks like, and here is why the math works better than the $1,500 repair bill you are about to authorize.
The economics of this pipeline are exceptional. Vehicles acquired through the service drive have documented maintenance histories, known mechanical condition, and zero auction fees — making them significantly more profitable to retail than units sourced through wholesale auctions. Transactions involving a trade-in generate substantially higher gross profit for the dealership. According to 2024 industry data, used vehicle transactions with a trade-in carried an average transaction price premium of over $7,000 compared to transactions without one.
When a service-drive trade-in converts into a sale, the dealership captures profit at every layer: the new or used vehicle margin, the F&I product origination, the below-market-cost acquisition of the trade-in for resale, and the reset of the customer’s maintenance cycle back to day one. One interaction, four profit events — all originating from the service department.
The retention statistics reinforce this further. Customers who regularly service at the dealership where they purchased their vehicle are 74% more likely to buy their next vehicle from that same dealership. If they defect to an independent mechanic, that likelihood drops to roughly 35%. A poorly managed service department does not just forfeit repair revenue — it severs the future sales pipeline.
Prime Insight
When the Fund Managers for Prime Dealer Equity Fund evaluates a potential dealership investment, the fixed operations performance is the first line item examined. A store with a low absorption rate and a shallow service customer base is not a weak asset — it is an under-optimized one. The Coleman team has a proven playbook for moving that number.
The Tailwinds That Guarantee Long-Term Demand
Three macro forces are converging to structurally expand the total addressable market for dealership fixed operations — and none of them are going away.
The first is the aging vehicle fleet. The average age of a vehicle on American roads has reached a record 12.8 to 14 years. Elevated new vehicle prices — routinely above $47,000 — have pushed large segments of consumers out of the new car market entirely. High interest rates have made financing even less accessible. The result is an expanding population of older vehicles logging record miles — 3.55 trillion miles driven in 2024 — that require increasingly frequent and increasingly expensive maintenance. Older vehicles do not just need oil changes. They need suspension overhauls, transmission repairs, electrical diagnostics, and heavy mechanical work. That is high-margin, high-ticket customer-pay volume flowing directly into the service bay.
The second is vehicle complexity. Modern vehicles are rolling computers equipped with advanced driver assistance systems, radar and LiDAR sensor suites, and integrated infotainment networks. Independent repair shops — which currently capture roughly 66% of all U.S. service visits — increasingly lack the capital for OEM-specific diagnostic software, ADAS calibration equipment, and factory-certified technician training. As vehicle architecture evolves, consumers are forced back to the franchised dealer for repairs that independent mechanics cannot perform. The franchised dealership’s competitive moat deepens with every model year.
The third is the EV transition. The conventional fear — that electric vehicles will destroy the service department because they have no oil changes — misses the operational reality. While routine maintenance frequency may decline, the average repair order value for a BEV is substantially higher than for a traditional vehicle. High-voltage battery systems, thermal management, software programming, and accelerated tire wear from the extreme weight and torque of EVs drive per-visit revenue that more than compensates for reduced visit frequency. And because independent shops are largely unequipped to service high-voltage architectures safely, BEV owners are deeply tethered to the franchised dealer network. Dealerships that invest early in EV infrastructure effectively monopolize this emerging, high-margin repair category.
The total U.S. auto care and repair market is estimated at $373 billion. Franchised dealers currently capture about 28% of it. The remaining $130 billion-plus sitting with independent shops represents immediate, capturable market share for any operator willing to solve the scheduling, transparency, and communication problems that drive customers away from the dealership in the first place.
Why This Changes the Investment Thesis
The perception of a dealership as a volatile retail business that lives and dies with monthly car sales is a fundamental miscalculation. The showroom is the face of the franchise. The service bay is the financial foundation.
Fixed operations is a $156 billion recurring revenue engine that is structurally insulated from every force that makes the sales floor unpredictable — interest rate shocks, inventory gluts, consumer confidence swings, tariff threats, and manufacturer pricing missteps. It generates gross margins that are five to ten times higher than new vehicle sales. It converts satisfied buyers into lifetime service clients whose retention directly fuels the next vehicle sale. And it operates on a demand base — aging vehicles, increasing complexity, mandatory maintenance — that is expanding, not contracting.
For the investor evaluating whether automotive retail belongs in a diversified portfolio, the answer is not found on the showroom floor. It is found in the service bay. And the difference between a dealership that captures this value and one that leaves it on the table comes down to one thing: the quality of the operator running the department.
That is the investment we make every time we acquire a store. And it is the reason the stores in the Fund portfolio are expected to perform the way they will.
Prime Dealer Equity Fund is a private equity vehicle co-investing with Coleman Automotive Group in the acquisition and optimization of automotive dealerships across the United States.
For qualified investor inquiries:
→ Contact our investor relations team